
Debugging And Steering
Debug Views
This week I couldn't find a lot of time to make progress on my home project, so I decided to do a bit of cleaning in my code and implement a few debug views.
As I stated a couple updates ago, my rendering pipeline is split in multiple systems to ensure it can be used both in standalone and editor modes. However I may have had a few too many splits:
- poll window events
- bind scene framebuffer
- render meshes
- render debug mesh
- bind window framebuffer
- render post process
- swap buffers
The issue with this many split is that a few of those systems actually share a lot and often need the GPU to reference the same data (e.g. camera position or FOV, screen size) and writing debug views makes this even worse (sharing debug mode, various textures, etc.). So I decided to collapse a few of those systems:
- poll window events
- render scene (binds appropriate framebuffers, renders meshes, performs post process)
- render debug mesh
- swap buffers
I know have a "big" render scene system that is easier to optimize all together (yes, it is still split in functions ;D).
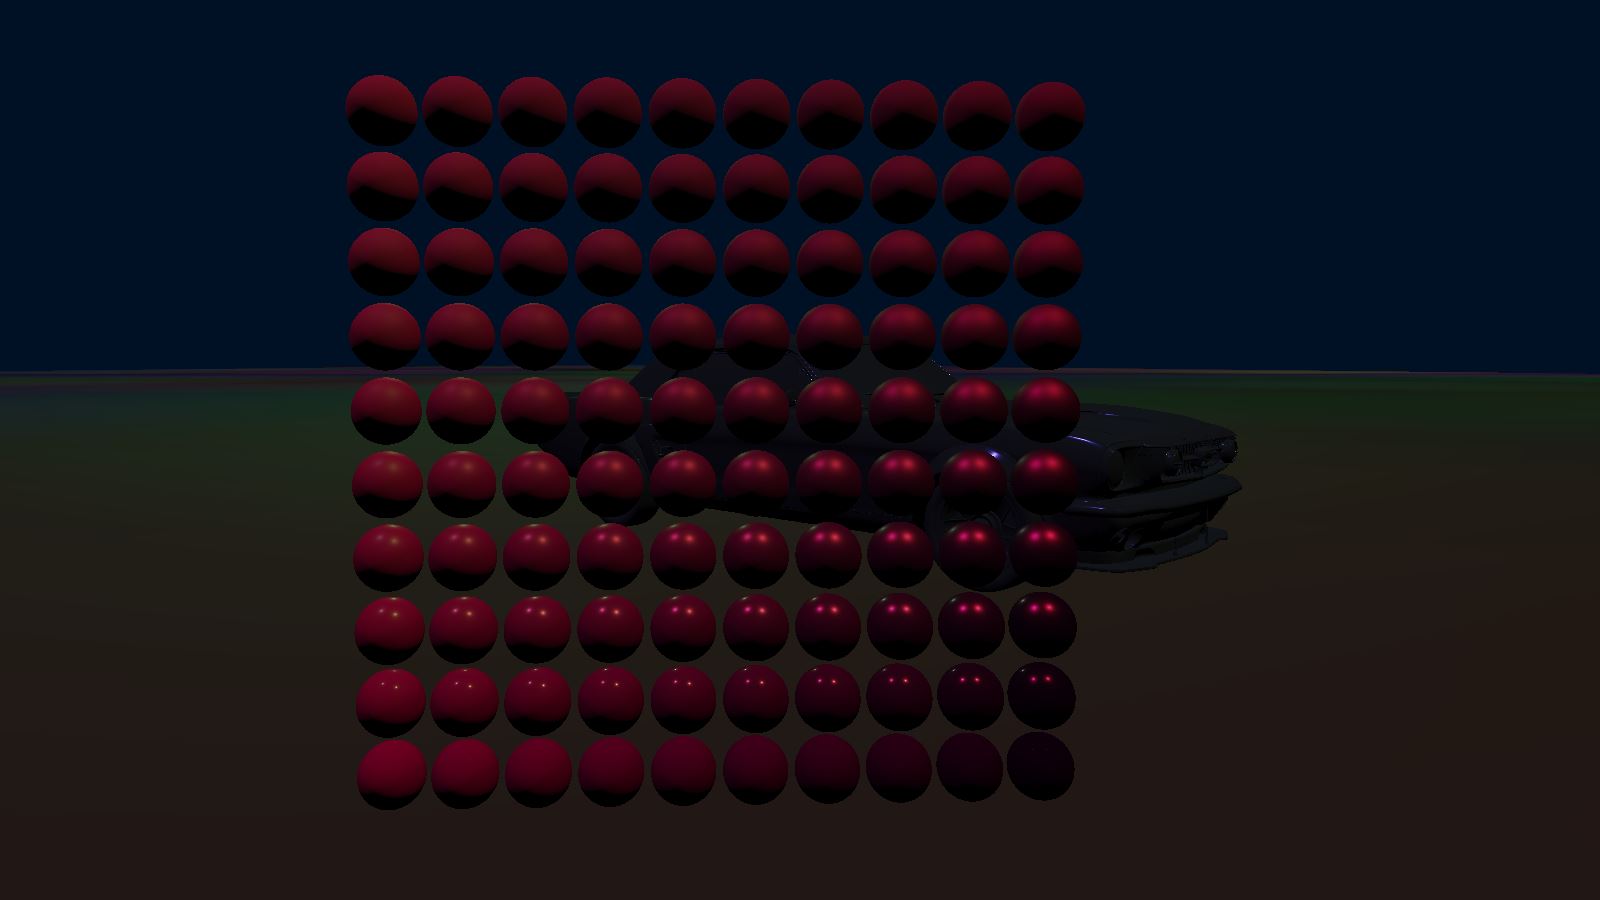
While this was happening, I was playing around with last week's PBR results and noticed I was struggling to correctly represent dielectric / metallic / smooth / rough materials correctly. Result I showed last week were bugged each time I tried to change my material properties. Off course, the reason was the most annoying one: an alignment mismatch between the C++ struct defining data sent to the Graphics Card and the GPU struct data is actually mapped to (there is a standard but it can be quite complex to follow at times) ; after hours spent debugging this issue, I decided to represent this classic model to convince myself I had finally implemented the correct pipeline (roughness increases bottom to top, metal-ness increases left to right):
Finally, I went onto implementing various views to help debug what GPU is doing. In particular, displaying areas covered by the scene's lights, as well as displaying the state of renderbuffers (informations related to pixels being rendered such as color or depth) or mesh properties (normals, UVs, etc.).
Performance
Upon implementing the various debug views I also noticed that performance had tanked compared to two weeks ago. Profiling was putting the guilt on the ImGui rendering system which seemed oddly suspicious. Upong investigating, it turned out to be the rendering pipeline I had been implementing (who would have guessed?) but that ImGui was taking the blame for being executed right after.
Investigating the performance of a rendering pipeline is actually quite interesting when the GPU is slowing down the CPU (you can't profile the GPU as easily as you can the CPU). Instead, you can send commands to the GPU, in between other rendering commands, that order it to measure time. Later, once everything has been processed, you can fetch the result of those special commands.

This investigation led me to realize that the light clustering algorithm (that tells what light(s) affect each part of the frustum) is very expensive despite being optimized, so I will have to further optimize it in the future (maybe ignore small lights at a distance and only account for the big ones when far from the camera?).
I also learned that the saying "do not use branches on GPU" is sometimes not applicable. I had implemented the principal shader in a way as to avoid branching based on how many lights were affecting the fragment (instead I was iterating over the maximum number of light possible per fragment, so 64 in my case) but it turns out to cost at least an extra 1ms versus simply branching out once the current light count in fragment's cluster was reached. After implementing this easy fix, performance for a thousand lights and models reached an acceptable 350fps.
Pseudo Animation
So I was a bit too eager to feel like I was driving some sort of vehicle (don't pay attention to the ugly 3D model you will see in following videos, it's only there to somewhat visualize the collision shape) and decided I would implement a custom shader to rotate the wheels. Well, between intention and realization, there is a world! Here is a few bloopers:
So, as I said I was a bit too eager since the correct way (at least for wheel steering) would probably be to correctly implement shading for skeletal mesh but I instead created a weird and highly custom shader that can only render wheels. The main inconvenient -on top of it not scaling- is that it makes it impossible to do a depth-pre-pass (the technique that consist in using a simple/cost-free shader to write into the depth buffer once and thus save a lot of over-draw later on) since my depth-pre-pass shader has no idea how this wheel shader works.
Anyway, performance tanked again but here is the result:
Newsletter & Next Week
Ok I lied, I managed to do a bit of work in the end, especially this weekend! I re-did my blog-post editor and it's such a breeze to write those updates now. You may have noticed that previous posts were using images instead of properly embedded videos? This is because I was sending for the newsletter the exact same HTML I was displaying on this site, and embedded videos do not work in email.
That's why today I spent the day implementing a pseudo markdown language to help me format those posts. It supports basic markdown for titles, italic, bold, paragraphs, links, etc. but also custom commands for displaying images or videos in a consistent way.
// Before
<a href='https://youtu.be/0jqqtR45a8g'><img src='https://drouin.io/images/LightCountInClusters.jpg' title='Visualizing lights.'/></a>
<a href='https://www.aortiz.me/2018/12/21/CG.html'><img src='https://drouin.io/images/ForwardPlusGrid.jpg' title='Forward+.'/></a>

// After
!yt(0jqqtR45a8g)
!img(images/ForwardPlusGrid.jpg, Forward+., https://www.aortiz.me/2018/12/21/CG.html)
This means that I can now render it differently on the website and on the email I send you! And both now clearly show which part of my work can be viewed as a video, so no more excuse to miss them!
Next week/month, I have a lot of debugging to do. I noticed the physics is somewhat broken (probably related to how I handle the multi-threading of rendering vs physics but I'll come back to this in the future), the wheel rendering as I said is far too hacky and non efficient, the physics tick rate is unwillingly variable, etc. Stay tuned!